TL;DR
In unsupervised learning, clustering is essential for uncovering natural groupings in data, helping us gain new insights. Two of the most common approaches are K-Means Clustering and Hierarchical Clustering—but how do they actually differ under the hood?
In unsupervised learning, clustering is essential for uncovering natural groupings in data, helping us gain new insights. Two of the most common approaches are K-Means Clustering and Hierarchical Clustering. Both rely on proximity values at their core, but how do they actually differ in practice? Today, we’ll break down how each method works so we can demystify the black box behind these clustering techniques—often implemented in just a few lines of code.
K-Means Clustering

K-Means Clustering is a centroid-based approach, where each cluster is represented by a central point. The algorithm seeks to find K centroids that minimize overall error. We can evaluate clustering performance through variance, which comes in two forms: intra-cluster variance and inter-cluster variance.
Intra-cluster variance measures how far data points within a cluster are from their centroid. We typically use Sum Squared Error (SSE) for this, and we want this value to be as low as possible—indicating that our centroids are effective and the data points are tightly grouped together.
Inter-cluster variance measures the separation between different clusters, often calculated as the distance between centroids. We want this value to be high, as it means clusters are well-separated and less likely to overlap.

To run K-Means, we must first specify K—the number of clusters we expect. This might come from downstream requirements; for example, a marketing team might need exactly 3 customer tiers. Once K is set, the algorithm proceeds as follows:
- Randomly initialize K centroids
- Each data point calculates its proximity to every centroid
- Each point assigns itself to the nearest centroid (minimum distance)
- After all points are assigned, recalculate each centroid as the mean of its cluster members
- Repeat steps 1–4, with the algorithm tracking previous iterations to check for convergence
- The algorithm terminates when the current and previous iterations show no changes
However, this approach requires us to specify K upfront. If we don’t know K or need to change it, we must rerun the entire computation. K-Means is also sensitive to cluster shape, as it assumes spherical clusters. Data with other geometries may yield poor results, though we can sometimes work around this by increasing K to create smaller subclusters that better fit non-spherical shapes.
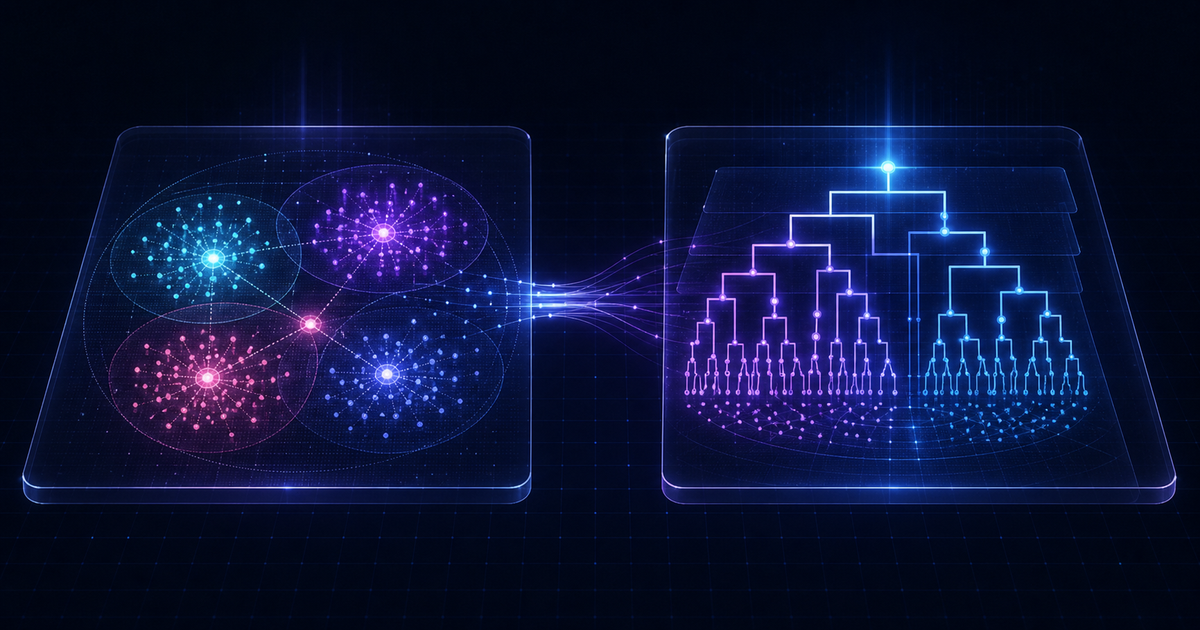
Hierarchical Clustering

Hierarchical Clustering organizes data into a tree-like structure called a dendrogram. The dendrogram shows which data points are most similar, grouping them together first.

This approach offers more flexibility: after the hierarchy is built, we can decide on the number of clusters (K) later by cutting the dendrogram at the desired level.
Hierarchical Clustering has two main variants: Agglomerative and Divisive. Here, we’ll focus on Agglomerative.
The algorithm begins by constructing a proximity matrix containing the proximity between every pair of data points. Once we have this matrix, the algorithm finds the pair with the highest similarity (smallest distance) and merges them. It then updates the proximity matrix to reflect this merged cluster.
You might wonder: how do we calculate proximity between subclusters (merged groups)? There are several methods:
-
Single-link (MIN) — Selects the minimum proximity from all pairs between members of subcluster 1 and subcluster 2. For example, with subclusters (A, B) and (C, D, E), we’d compute A-C, A-D, A-E, B-C, B-D, B-E, and take the smallest value.
-
Complete-link (MAX) — Selects the maximum proximity from all pairs between members of the two subclusters.
-
Average-link — Computes the proximity between every member pair across subclusters, then takes the average.
-
Centroid — Uses each subcluster’s centroid as its representative, then measures proximity between centroids.
More sophisticated methods exist as well. An important clarification: these four methods determine how proximity between subclusters is calculated. After updating the proximity matrix, the algorithm still selects the pair of subclusters with the highest similarity for merging, just as before.

To summarize Hierarchical Clustering:
- Build a proximity matrix for all data points
- Merge the two most similar members (subclusters)
- Update the proximity matrix to reflect the merged pair
- Repeat steps 1–3 until all members are combined into a single cluster (only one member remains in the proximity matrix), or until reaching a predetermined number of members
The final result is a dendrogram that can be used for further analysis.
Overall, we can see that K-Means follows a top-down approach: we fix the number of clusters first, then find members for each. Hierarchical clustering, by contrast, is more bottom-up: it gradually merges similar groups to build increasingly larger clusters.

In practice, we typically name each resulting cluster to make the output more actionable. We may also compute various metrics to better understand cluster characteristics.
Beyond these two algorithms, many others are worth exploring: Fuzzy Clustering, Affinity Propagation, Gaussian Mixture Models, and more. Each has its own strengths and ideal use cases. In the world of AI and data science solutions, there is no silver bullet—only the art of choosing the right tool for the specific problem and dataset at hand.
📚 Hope you enjoy reading!